Physical Activity Infographic 2022
Foreword
Is it possible and if yes, then how to motivate people to lead a physically active lifestyle? What should be done to make external motivation grow into an internal burning lifestyle? These and many other questions have been a topic YuMuuv has been working on since its inception - to help find a solution to the problem of insufficient physical activity globally.
YuMuuv's central solution to health promotion has so far been a platform for social cohesion challenges for employers and their employees. In the last 2.5 years, we have been able to help tens of thousands of people lead a healthier lifestyle, and reflecting on this data and experience, we have decided to publish a 3-part YuMuuv Data Series blog in the hope that it will further promote activity and mobility.
Table of Contents
Research questions
The purpose of the first part was to map the YuMuuv user profile and analyze whether and which personal characteristics or factors arising from the device used to affect the user's activity. We asked 3 main research questions:
- Is there a connection between the user's device and activity?
- Is there a connection between a user's age and activity?
- Is there a connection between a user's sex and activity?
In the following sections, it is planned to analyze whether and how an individual's activity is affected by the average activity level of their colleagues and the extent to which YuMuuv's challenges contribute to changing and maintaining a long-term lifestyle.
Sampling and limitations
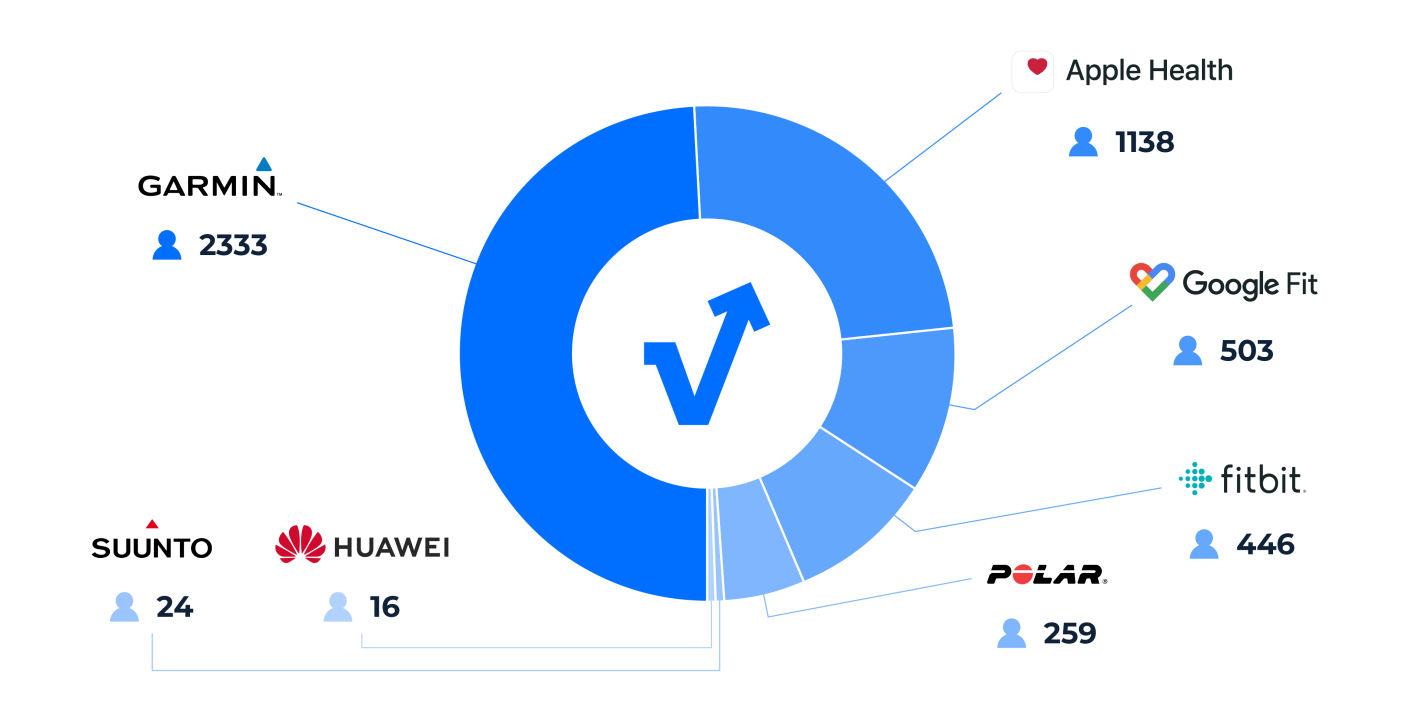
The sample of the YuMuuv survey was persons aged 18-73, of whom 4719 had regular heart rate and activity data in the 1st quarter of 2022. In addition, we used a sample of 3728 users without a pulse as a reference group. Users had integrated with Garmin, Fitbit, Polar, Suunto, Huawei, Apple Health, and Google Fit. In the case of the latter two, it is important to note that users may in turn have interfaced with a third-party device.
More broadly, the YuMuuv study did not focus on the measurement characteristics of the devices themselves (for example, when calculating the steps of a Polar device). In addition, due to the technicalities of the integration, we were not able to access the heart rate data of Polar, Suunto, and Huawei 24/7. In the case of the first two, we received only the heart rate recorded during training, and in the case of the latter, the heart rate of the other period was simply less frequent.
However, there is no reason to believe that these restrictions would have had a greater impact on the overall conclusions drawn from the users' data. It is important to emphasize that this is only an analysis of the YuMuuv user base, which may not be correlated with any other sample. In part, it can even be argued that certain findings were contrary to general societal norms.
Identifying the differences mentioned above would merit a separate science-based study. Therefore, after statistical analysis, we cannot provide fundamental scientific reasons for one or the other finding. This, too, deserves a more detailed examination. Based on our experience, we found it valuable to provide some supporting comments, explanations, and opinions in addition to the statistics.
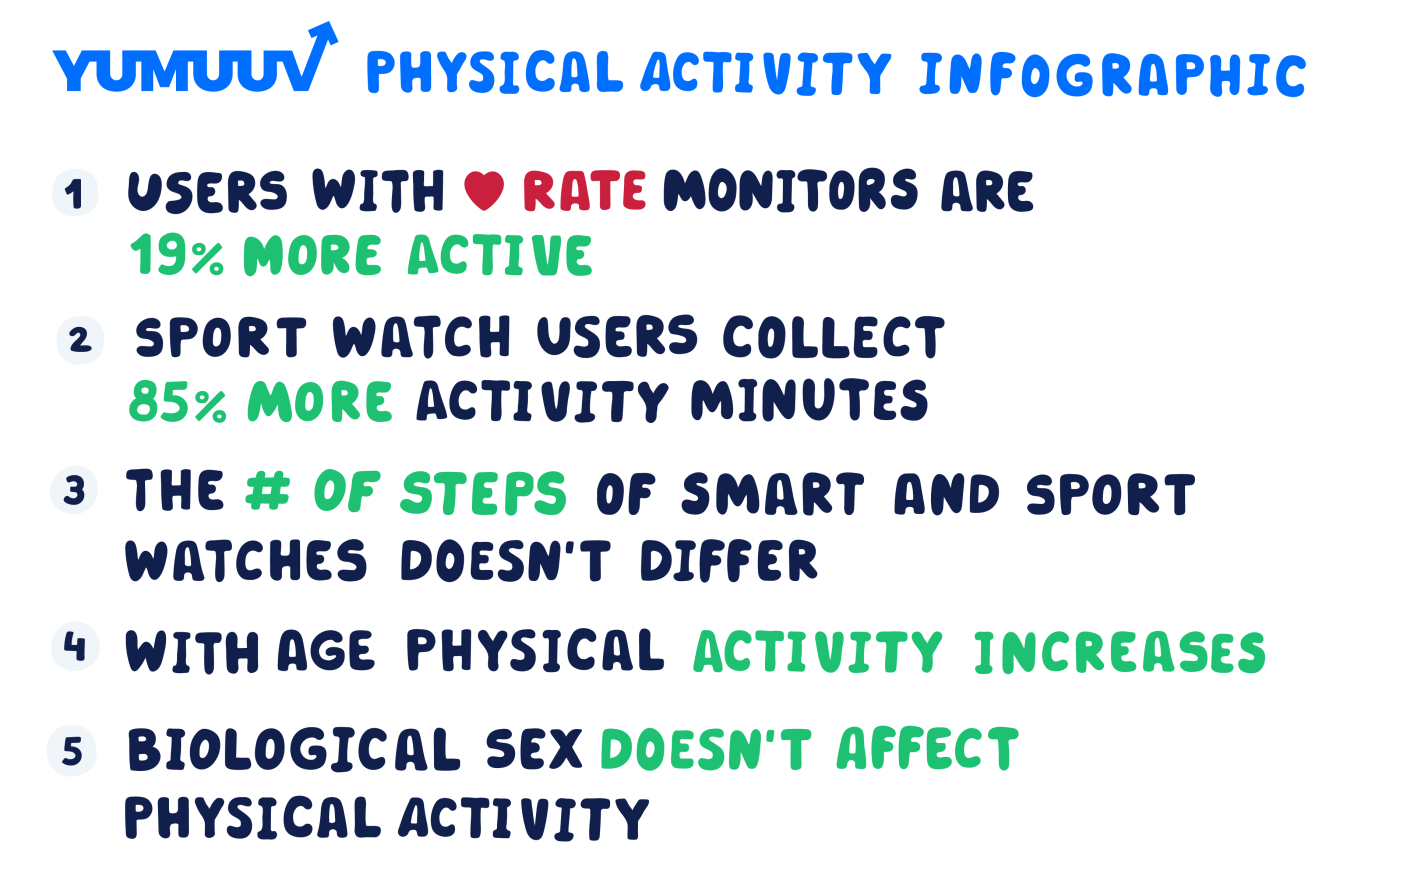
Results of the data analysis: 5 important findings
1. Users with heart rate monitors are more than 19% more active
Although the majority of activity monitors today already have a built-in heart rate measurement function, there are a sufficient number of those in our user base whose device does not allow it. Most of them are people who measure their activity with a smartphone, but in addition, there are users of all the above-mentioned service providers whose devices do not measure their heart rate.
First, we wanted to know if the heart rate function affects user activity. In a situation where in the comparison group did not have activity minutes (which we calculate directly from the heart rate on the YuMuuv platform), the only logical way to compare was to compare the users' steps. It was first seen that the number of steps taken by telephone users alone was more than 40% lower than that of heart rate activity device owners.
This difference can be caused by the inaccuracy of the phone as a pedometer and unequal wear compared to the wrist monitor owner. However, if we excluded all telephone users from the sample, the users of the devices that were actually worn on the wrist but did not measure the heart rate remained the comparison group. It was found that the number of steps of users with heart rate measurement was on average 19% higher than those without this functionality (7426 vs. 8853 steps).

That seems like a relatively big difference. There is reason to believe that the ability to monitor the heart rate also affects the intensity of a person's movement and the wider awareness and attention. It is for this reason that we have repeatedly pointed out that for an employer, providing an activity monitor that measures the pulse of an employee is a sure way to promote the activity and health of their team.
2. Sports watch users collect 85% more activity minutes
Next was our desire to focus specifically on analyzing users who already have a heart rate device. To do this, we first grouped them into sports and smartwatch categories. Users of Garmin, Polar, Fitbit, and Suunto went under the sports watch, and owners of Apple Health, Google Fit and Huawei devices went under the smartwatch category.
The WHO has recommended active exercise for at least 150 minutes a week. To define this activity, they have also generally suggested that a person moves with a heart rate higher than 65% of his or her personal maximum (regardless of activity). So we wanted to know if there are differences in the intense number of minutes depending on the type of equipment. It turned out that sports watch owners made 85% more intense minutes than smartwatch users.
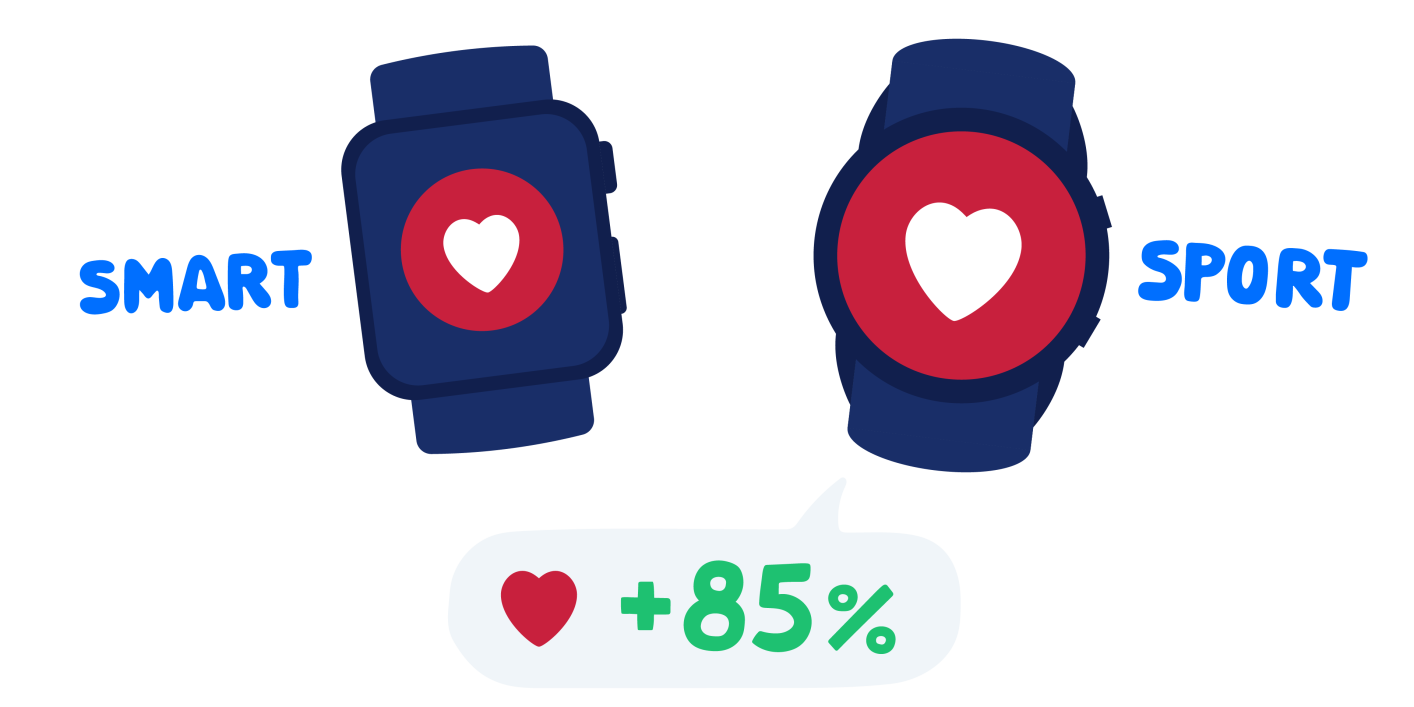
According to our data, the average sports watch owner did an intensive heartbeat of 21 minutes and 37 seconds a day, and the smart watch owner did 11 minutes and 39 seconds. That's almost 10 minutes more training a day, which accumulates a big difference in lifestyle over time.
What can cause this? We think that some of the people who are worried about the sports watch are already pre-tuned to intensive movement. On the other hand, due to the specifics of the device, the user has focused more on training, as it often lacks various additional functionalities that would distract from intense movement. In any case, when choosing a watch type, it is a worthwhile finding that the user should consider before making a purchase.
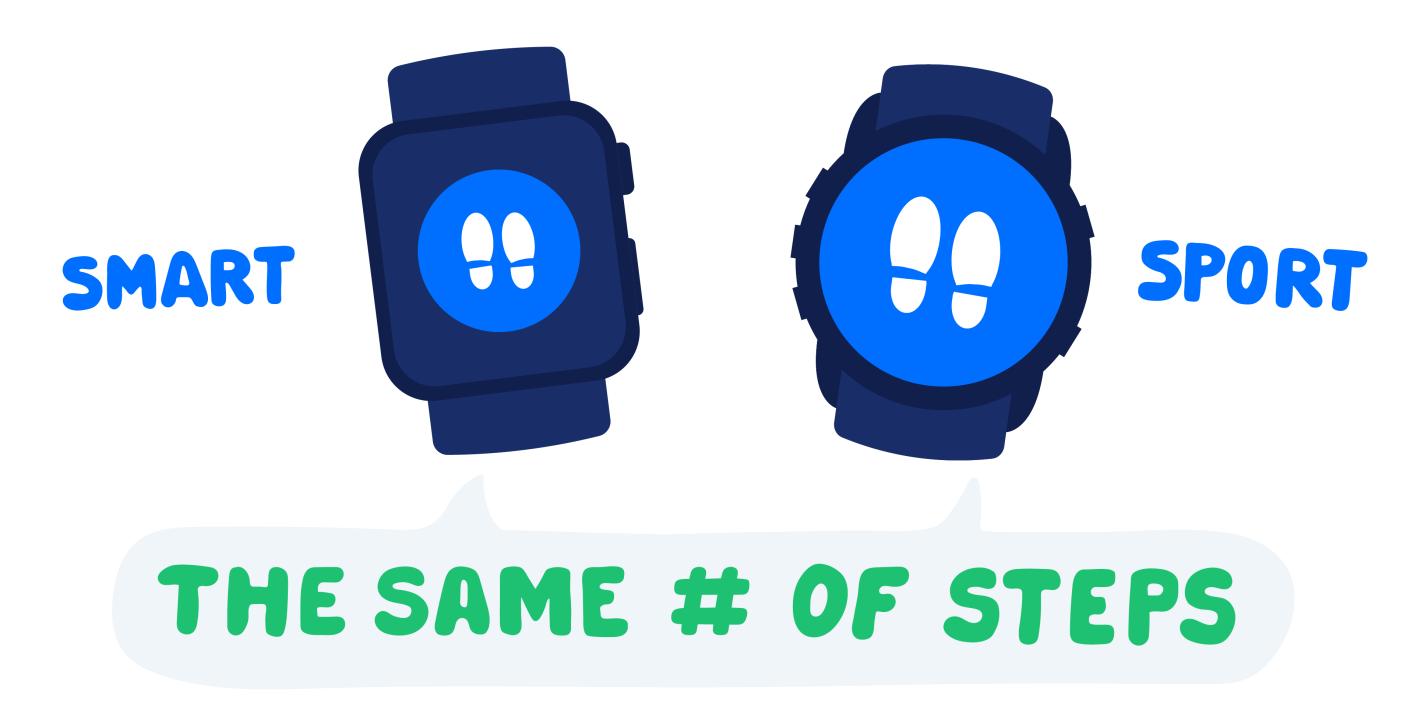
3. The number of steps of smart and sports watches owners does not differ significantly
If we had seen that there was a significant difference in the number of active minutes between sports and smartwatch users, then we assumed that this was also reflected in the number of steps to take, which would be another comparable activity indicator. However, when analyzing the data, we did not find such a proportional increase.
Rather, the difference was minimal, as the averages differed by only 2% in favor of the sports watch user (8498 vs. 8327 steps per day). We decided to discard the steps of the Polar watch users due to the peculiarities of their calculation, but this would not have significantly increased the growth either (to a maximum of 6.5%).
This inevitably raised the question of how it is possible that the difference in the number of steps is so small that more than half of the time spent by sports watch users are equated. In conclusion, we realized that the total number of steps is the simplest and most affordable goal a user can reach, regardless of their physical form.
This means that in comparison, a person who has focused on training does not see an extra need to fulfill the goal of steps in addition to collecting training time. He is satisfied with the feeling of training. At the same time, the user of the smartwatch is more focused on overall movement.
4. With age, physical activity increases
Next, it was important for us to understand how age relates to YuMuuv user activity. To do this, we divided people into groups ranging from 10 to 13 years. The result was that the further the age group, the higher the physical activity. In general, it can be said that each year added 47 steps and 36 intensively moved seconds to the average daily activity.
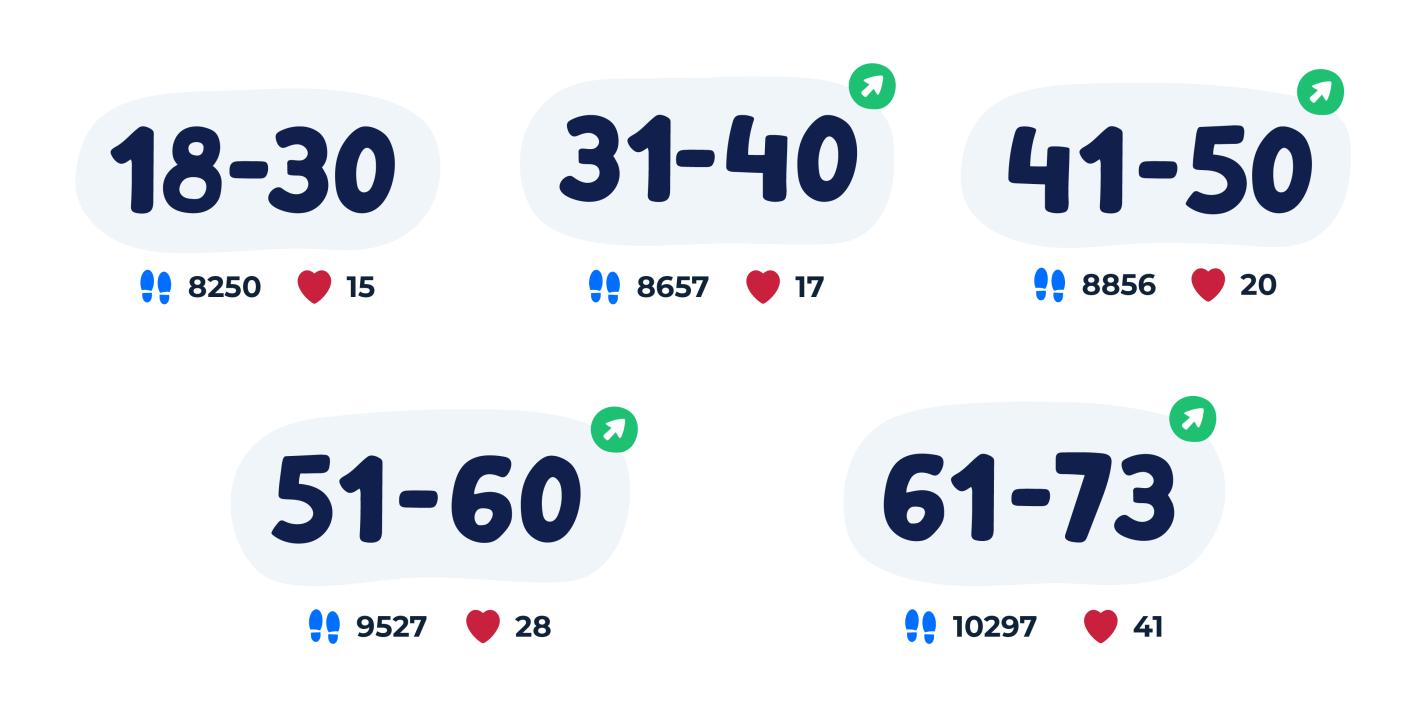
This is a significant change when comparing the youngest (18-30 years) and older (61-73) age groups. First, broader questions can be asked about the impact of people's jobs and occupations on their activity. As YuMuuv does not ask for precise data on the roles or positions of employees, we do not know whether or not older people are more mobile and younger people are more sedentary, but the subject is worth exploring further.
In a situation where the growth trend was uniform for intensity, steps, and kilocalories burned through the BMR index, this confirmed the increase in activity very clearly with increasing age. Interestingly, however, a number of broader studies have suggested that the activity of older people in the general population is declining.
One observations are certainly that the sample of YuMuuv users is clearly narrowing with age. This means that the older he is, the less he can represent the average individual in society. Rather, the YuMuuv user in the older age group represents a user with significantly higher technological capabilities and interest in their age. Be that as it may, in any case, it is worth equipping older people with simple equipment, as it can provide many times better health.
5. Biological sex does not affect physical activity
Finally, we were interested in whether, for users of the YuMuuv application, a person's biological sex has an effect on their activity. When we analyzed our user base, there were 2735 women and 1984 men in the sample. On this basis, it was found that the data of these users did not show a significant difference in activity behavior.
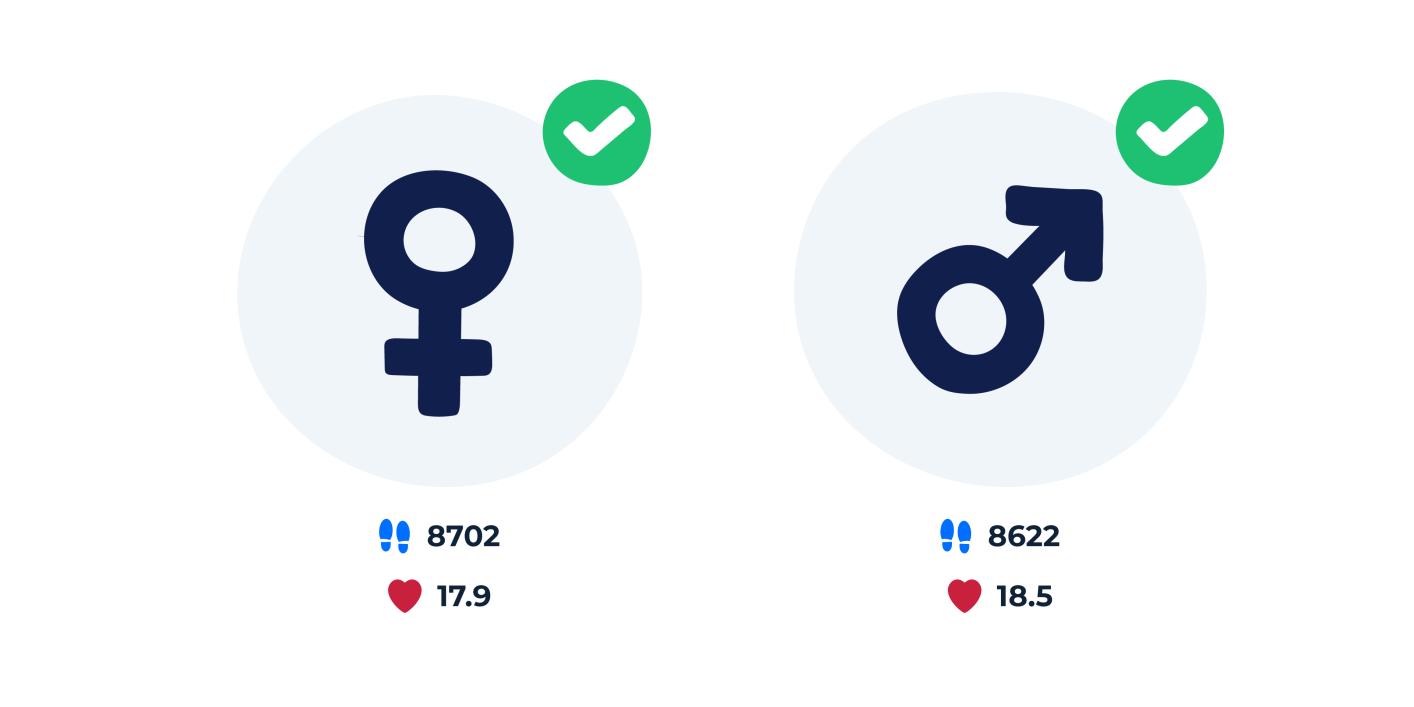
The average woman took only 0.92% more steps than men, which is within the statistical error. In the case of men, it was found that they did 38 minutes more intense exercise time than women, which is a difference of 3.5%. For the balancing kilocalories, the BMR for women was 1.51 and for men 1.49, a difference of 1.3%. Thus, the activity level was almost identical according to the gender of the user. This could be taken as a surprise on the one hand, but as an argument in favor of YuMuuv's harmonized activity measurement formula.
Summary
In conclusion, it can be said that the functionality of the device and the age of the user have some effect on human activity. As a practical guide, the employer could be told to take care of the health of their employees in a way that they ensure that everyone has a heart rate monitor. This is the easiest way to guarantee that the movement of workers is long-lasting and as positive as possible for their health. This investment is only a few tens of euros, but it will return dozens of times during the first years.
However, it is still important to say that all of our claims are not based on the average population, but on YuMuuv's user base. Still, we have enough confidence to say that we can help your company's employees to a medium level with very little effort. If you are interested, contact us and let's talk your needs through. The next part of the blog series will be published at the beginning of the new month at the latest.